| Nevada Creek Water Users Association | |||||||
| Irrigation Statistics WY2015 | |||||||
| provisional data – subject to revision | |||||||
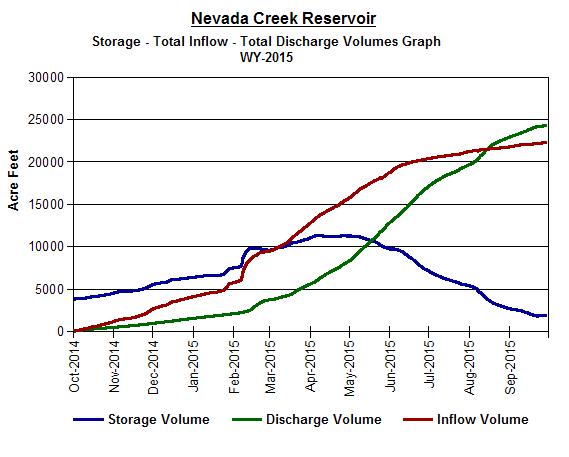
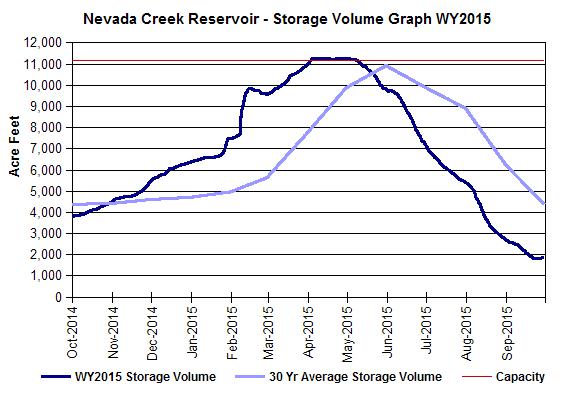
| Nevada Creek Reservoir | |||||||
| (Water Year -- Oct. 1, 2014 thru Sept. 30, 2015) | |||||||
| Peak Storage (volume) : | 11,285 | AF | Peak Storage (% of capacity) : | 101.2% | |||
| Low Storage (volume) : | 1,809 | AF | Low Storage (% of capacity) : | 16.2% | |||
| Total Inflow Volume : | 22,302 | AF | Median Gate Discharge (WY) : | 36.4 | cfs | ||
| Total Discharge Volume : | 24,292 | AF | Median Gate Discharge (Irrigation) : | 53.0 | cfs | ||
| Net Storage Gain : | -1,990 | AF | Peak Discharge (gate & spillway) : | 90.5 | cfs | ||
| Total Spill Days : | 36 | ||||||
| Upper Nevada Creek Drainage Totals – All Sections & Canals | |||||||
| (Irrigation Season -- May 1, 2015 thru Sept. 30, 2015) | |||||||
| Total Delivered Decreed* : | 13,631 | AF | Total Delivered Contract : | 7,803 | AF | ||
| Average Total System Loss : | 18.0% | ||||||
| Nevada Creek & Tributaries – Section A (above dam) | |||||||
| NCWUA Delivered Decreed* : | 1,323 | AF | Delivered Contract : | 925 | AF | ||
| Non-NCWUA Decreed** : | 3,308 | AF | |||||
| Nevada Creek & Tributaries – Section B (below dam) | |||||||
| Delivered Decreed* : | 7,318 | AF | Delivered Contract : | 1,037 | AF | ||
| Douglas Creek Canal | |||||||
| Total Days in Operation : | 144 | Median Flow Rate : | 28.4 | cfs | |||
| Total Canal Volume : | 8,512 | AF | Peak Flow Rate : | 52.6 | cfs | ||
| Total Irrigation Demand : | 6,726 | AF | Delivered Decreed (R/W) : | 1,562 | AF | ||
| Total Loss Volume : | 1,786 | AF | Delivered Contract : | 5,164 | AF | ||
| Loss Percentage : | 26.5% | Delivered Flood : | 0 | AF | |||
| North Helmville Canal | |||||||
| Total Days in Operation : | 44 | Median Flow Rate: | 16.8 | cfs | |||
| Total Canal Volume : | 1,441 | AF | Peak Flow Rate: | 29.1 | cfs | ||
| Total Irrigation Demand : | 797 | AF | Delivered Decreed (R/W) : | 120 | AF | ||
| Total Loss Volume : | 645 | AF | Delivered Contract : | 677 | AF | ||
| Loss Percentage : | 80.9% | Delivered Flood : | 0 | AF | |||
| * based on real measurements & partial estimates | |||||||
| ** based on estimates | |||||||
|
|
|||||||