| Nevada Creek Water Users Association | |||||||
| Irrigation Statistics WY2013 | |||||||
| (Oct. 1, 2012 thru Sept. 30, 2013) | |||||||
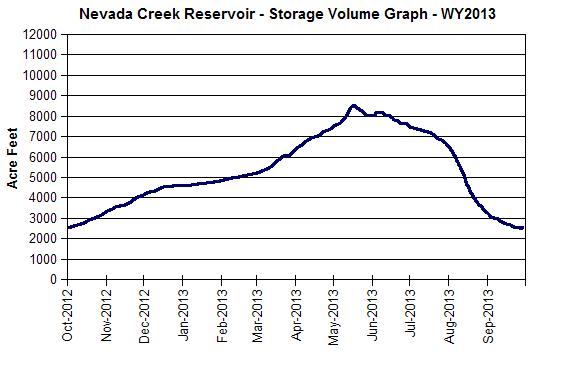
| Nevada Creek Reservoir | |||||||
| Peak Storage (volume): | 8,518 | AF | Peak Storage (% of capacity): | 76.4% | |||
| Low Storage (volume): | 2,525 | AF | Low Storage (% of capacity): | 22.6% | |||
| Total Inflow Volume: | 15,419 | AF | Median Gate Discharge: | 28.1 | cfs | ||
| Total Discharge Volume: | 15,440 | AF | Peak Discharge: | 86.6 | cfs | ||
| Net Storage Gain: | -21 | AF | Total Spill Days: | 0 | |||
| Nevada Creek – Section A (above dam) | |||||||
| Total Delivered Decreed*: | 1,914 | AF | Total Delivered Contract*: | 332 | AF | ||
| *Section A data is incomplete & does not accurately represent actual total usage | |||||||
| Nevada Creek – Section B (below dam) | |||||||
| Total Delivered Decreed*: | 4,122 | AF | Total Delivered Contract: | 705 | AF | ||
| * does not include unmonitored tributary usage | |||||||
| Douglas Creek Canal | |||||||
| Total Days in Operation: | 135 | Median Flow Rate: | 27.9 | cfs | |||
| Total Canal Volume: | 7,326 | AF | Peak Flow Rate: | 44.0 | cfs | ||
| Total Irrigation Demand: | 5,966 | AF | Total Decreed (R/W): | 1,527 | AF | ||
| Total Loss Volume: | 1,361 | AF | Total Contract: | 4,438 | AF | ||
| Average Loss Percentage: | 22.8% | Total Flood: | 0 | AF | |||
| North Helmville Canal | |||||||
| Total Days in Operation: | 67 | Median Flow Rate: | 7.9 | cfs | |||
| Total Canal Volume: | 1,259 | AF | Peak Flow Rate: | 22.5 | cfs | ||
| Total Irrigation Demand: | 753 | AF | Total Decreed (R/W): | 230 | AF | ||
| Total Loss Volume: | 505 | AF | Total Contract: | 523 | AF | ||
| Average Loss Percentage: | 67.1% | Total Flood: | 0 | AF | |||
|
|
|||||||