| Nevada Creek Water Users Association | |||||||
| Irrigation Statistics WY2012 | |||||||
| (Mar. 1, 2012 thru Sept. 30, 2012)* | |||||||
| *current record process began in Spring-2012, data does not span full water year | |||||||
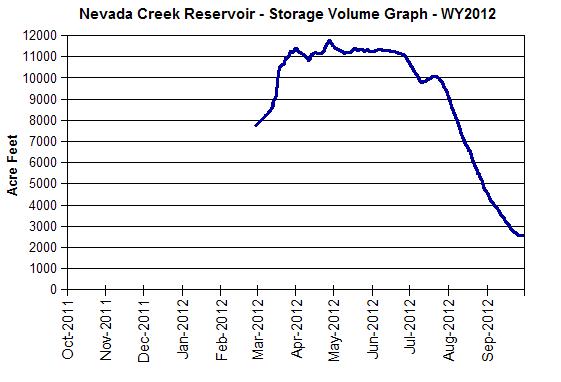
| Nevada Creek Reservoir | |||||||
| Peak Storage (volume): | 11,754 | AF | Peak Storage (% of capacity): | 105.4% | |||
| Low Storage (volume): | 2,566 | AF | Low Storage (% of capacity): | 23.0% | |||
| Total Inflow Volume: | 35,485 | AF | Median Gate Discharge: | 80.0 | cfs | ||
| Total Discharge Volume: | 40,529 | AF | Peak Discharge (spillway): | 347.2 | cfs | ||
| Net Storage Gain: | -5,044 | AF | Total Spill Days: | 75 | |||
| Nevada Creek – Section A (above dam) | |||||||
| Total Delivered Decreed*: | AF | Total Delivered Contract*: | AF | ||||
| *Incomplete data to report for this section | |||||||
| Nevada Creek – Section B (below dam) | |||||||
| Total Delivered Decreed*: | 1,146 | AF | Total Delivered Contract: | 542 | AF | ||
| * does not include unmonitored early flood water or tributary usage | |||||||
| Douglas Creek Canal | |||||||
| Total Days in Operation: | 135 | Median Flow Rate: | 39.1 | cfs | |||
| Total Canal Volume: | 10,823 | AF | Peak Flow Rate: | 67.5 | cfs | ||
| Total Irrigation Demand: | 8,262 | AF | Total Decreed (R/W): | 1,654 | AF | ||
| Total Loss Volume: | 2,561 | AF | Total Contract: | 4,430 | AF | ||
| Average Loss Percentage: | 31.0% | Total Flood: | 2,178 | AF | |||
| North Helmville Canal | |||||||
| Total Days in Operation: | 82 | Median Flow Rate: | 17.4 | cfs | |||
| Total Canal Volume: | 3,164 | AF | Peak Flow Rate: | 39.3 | cfs | ||
| Total Irrigation Demand: | 1,255 | AF | Total Decreed (R/W): | 436 | AF | ||
| Total Loss Volume: | 1,909 | AF | Total Contract: | 566 | AF | ||
| Average Loss Percentage: | 152.1% | Total Flood: | 253 | AF | |||
|
|
|||||||